Business Benefits
Build attribution models tailored to fit your business and domain area.
Use tools like the SegmentStream JavaScript SDK to collect and store all possible website interactions and micro-conversions in Google Big Query.
For example, micro-conversions that could be collected on an ecommerce product page for a fashion website include image impressions, image clicks, checking size, selecting size, adding to cart, and adding to wishlist.
You can also do the same by exporting hit-level data into Google BigQuery with Google Analytics 360, which has a built-in export to BigQuery. Google Analytics API will not work here, as it provides aggregated data, while hit-level data is required for ML. But new GA4 data will work.
Process the raw data into attributes, where every session has a set of features and a label.
Other examples of features include:
- Recency features. How long ago an event or micro-conversion happened in a certain timeframe;
- Frequency features. How often an event or micro-conversion happened in a certain timeframe;
- Monetary features. The monetary value of events or micro-conversions that happened in a certain timeframe;
- Contextual features. Information about user device, region, screen resolution, etc.;
- Feature permutations. Permutations of all above features to predict non-linear correlations.
Use SQL code to train a model with all possible non-linear permutations, learning and validation set splits, etc. within the Google BigQuery data warehouse.
For example, to create a model that predicts the probability to buy in the next 7 days based on a set of behavioral features, you just need to run an SQL query like this one:
CREATE OR REPLACE MODEL
`projectId.segmentstream.mlModel`
OPTION
( model_type = 'logistic_reg')
AS SELECT
features.*
labels.buyDuring7Days AS label
FROM
`projectId.segmentstream.mlLearningSet`
WHERE date BETWEEN ‘YYYY-MM-DD’ AND ‘YYYY-MM-DD’
```Replace `projectId` with your own Google Cloud project ID, `segmentstream` with your own dataset name, `mlModel` with your own model name, `mlLearningSet` with the name of the the table with your features and labels, and `labels.buyDuring7Days` with your own label.


## Use a simple query to evaluate and visualize all the characteristics of your model.

For example, the following query visualizes the precision-recall curve, precision and recall vs. threshold, and ROC curve:
 SELECT * FROM
          ML.EVALUATE(MODEL `projectId.segmentstream.mlModel`,
          (
                SELECT
                       features.*,
                      labels.buyDuring7Days as label
                FROM
                      `projectId.segmentstream.mlTrainingSet`
                WHERE
                      date > 'YYYY-MM-DD'
         ),
         STRUCT(0.5 AS threshold)
     )
## Apply your model to behavior-based attribution.
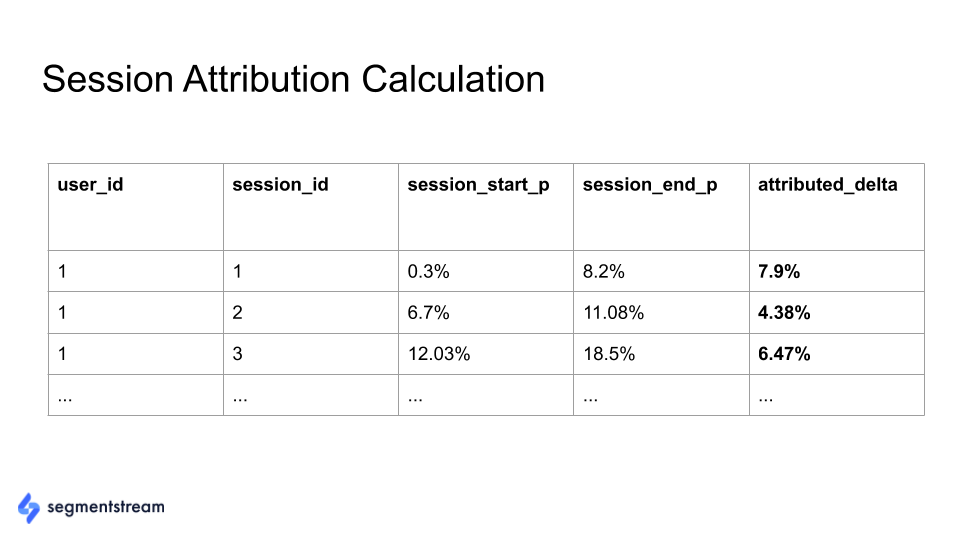
For instance, if you have a model that predicts the probability of a user to buy within the next seven days, you can use it to allocate value to different traffic sources, predict the user's probability to buy at the beginning and end of the session, and calculate the value between the beginning and end of the session. You could create the following table for each user session in your Google BigQuery database, where:
- **session_start_p** is the predicted probability to buy in the beginning of the session.
- **session_end_p** is the predicted probability to buy at the end of the session.
- **attributed_delta** is the value allocated to the session.
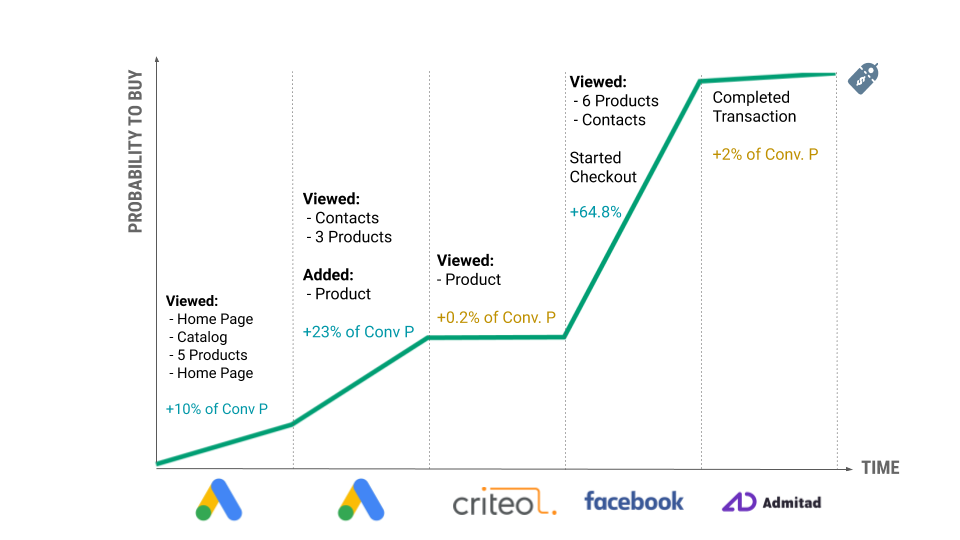
This would then produce values for all tracked channels/campaigns based on how they impact a user's probability to buy in the next 7 days during the session:
Last edited by @hesh_fekry 2023-11-14T16:01:29Z
